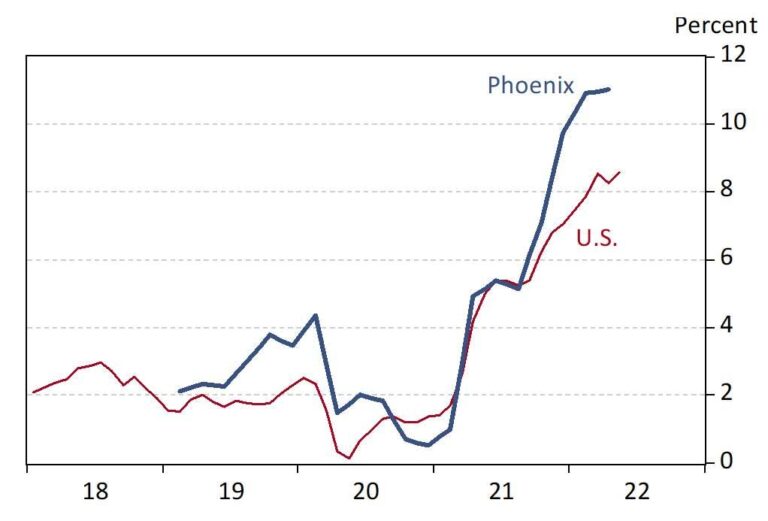
Inflation has become a defining economic concern across the United States, but its impact varies significantly from city to city. In Phoenix, residents are experiencing a unique inflationary landscape compared to the national average. The latest analysis reveals how the desert metropolis is faring amid rising prices, shedding light on factors driving local cost increases and what this means for households and businesses. This article explores how inflation in Phoenix stacks up against trends nationwide, offering a detailed look at the numbers behind the headlines.
Phoenix Inflation Trends Outpace National Averages Impacting Local Cost of Living
Phoenix has recently experienced inflation rates significantly higher than the national average, intensifying the strain on household budgets across the metropolitan area. Key drivers include soaring prices in housing, transportation, and food sectors, outpacing the U.S. headline inflation figures by an estimated 1.5 to 2 percentage points over the past year. This trajectory has heightened concerns among residents, with many reporting that day-to-day expenses are quickly eroding disposable income and challenging financial planning.
A closer look at the inflation components reveals the following localized trends:
- Housing Costs: Rent and home prices increased by nearly 12%, influenced by demand outstripping supply.
- Transportation: Gasoline prices surged in conjunction with rising commuting demands, pushing costs up by 8.7%.
- Food & Groceries: Grocery store prices climbed sharply, with some staples seeing increases over 10%.
| Category | Phoenix Inflation Rate | National Inflation Rate |
|---|---|---|
| Housing | 12.0% | 9.3% |
| Transportation | 8.7% | 6.1% |
| Food & Groceries | 10.2% | 7.4% |
| Overall CPI | 9.8% | 8.1% |
Sector Breakdown Reveals Rising Prices in Housing and Transportation as Major Drivers
Across Phoenix, rising costs in housing and transportation sectors are emerging as primary contributors to the city’s inflationary pressures. The surge in home prices, driven by limited supply and strong buyer demand, has eclipsed the national average increase, making it increasingly difficult for residents to find affordable housing. Meanwhile, transportation costs, including fuel and vehicle expenses, have also climbed sharply, reflecting broader disruptions in supply chains and increased consumer demand. These dual factors have combined to disproportionately elevate the cost of living in the Phoenix metro area compared to many other U.S. cities.
Other sectors show more moderate inflationary trends, but the gap created by housing and transportation is stark. Below is a quick comparison of inflation drivers between Phoenix and the national average:
| Sector | Phoenix Inflation Rate | U.S. Inflation Rate |
|---|---|---|
| Housing | 9.3% | 6.7% |
| Transportation | 8.5% | 7.1% |
| Food | 3.1% | 3.6% |
| Healthcare | 2.8% | 3.0% |
These dynamics suggest that families and individuals in Phoenix are facing cost pressures not only from housing scarcity but also from transportation challenges, creating a complex inflation landscape unique from much of the country.
Experts Weigh In on Economic Factors Fueling Phoenix Inflation Surge
Experts highlight several intertwined economic factors contributing to Phoenix’s inflation surge, setting it apart from national trends. Supply chain disruptions, particularly in construction materials and automobiles, have driven prices sharply higher in local markets. Additionally, the regionŌĆÖs rapid population growth has amplified demand for housing and everyday goods, further straining availability and pushing costs upward. Local wage increases have also played a role, as employers compete for a limited workforce amid a stronger-than-average labor market, which can translate into higher consumer prices.
Economic analysts point out that while Phoenix inflation rates outpace many other metropolitan areas, the trend aligns with Southwest regional pressures fueled by climate-related agricultural impacts and energy demand spikes. The following table compares inflation components between Phoenix and the national average, illustrating key discrepancies affecting residentsŌĆÖ wallets:
| Category | Phoenix Inflation | National Inflation |
|---|---|---|
| Housing Costs | +12.5% | +8.3% |
| Energy Prices | +10.2% | +6.1% |
| Transportation | +9.8% | +7.4% |
| Food & Beverages | +6.7% | +5.4% |
Together, these economic factors underscore a complex landscape where Phoenix residents face distinct inflationary pressures not observed as intensely elsewhere in the country. Policymakers and local businesses alike are closely monitoring these trends to adapt strategies that address affordability challenges in the region.
Strategies for Residents to Navigate Rising Costs and Protect Household Budgets
As the cost of living continues to surge across Phoenix, residents are adopting smart financial habits to stretch every dollar. Prioritizing essential expenses and cutting back on discretionary spending can mitigate the impact of inflation. Many households are increasingly turning to budgeting apps and digital tools that provide real-time expense tracking, helping pinpoint areas where savings are possible. Community resources, such as food co-ops and local farmers’ markets, offer affordable alternatives to conventional grocery stores, supporting both bottom lines and local economies. Additionally, residents are exploring energy-saving measuresŌĆölike programmable thermostats and LED lightingŌĆöto lower utility bills amid rising prices.
Adapting to inflation also means tapping into supplemental income streams. Gig economy jobs, part-time work, or freelance gigs can provide a vital financial cushion without long-term commitments. Pooling resources and sharing costsŌĆöfor instance, through carpooling or shared housing expensesŌĆöare practical strategies gaining momentum. The following table highlights some effective budget protection tactics with estimated monthly savings for a typical Phoenix household:
| Strategy | Estimated Monthly Savings |
|---|---|
| Switching to LED Bulbs | $10-$15 |
| Using Public Transit or Carpooling | $50-$75 |
| Meal Planning & Bulk Buying | $60-$90 |
| Freelance or Gig Work | $200+ |
In Conclusion
As inflation continues to impact households across the nation, PhoenixŌĆÖs experience offers a telling snapshot of broader economic trends shaping the American landscape. By examining how price increases in the Valley compare to other regions, residents and policymakers alike can better understand the challenges ahead and craft informed responses. Staying informed about local inflation dynamics remains essential as Phoenix navigates the evolving cost of living in the months to come.


